Understanding the customer journey is essential for every marketer, sales professional, and business owner. In today’s competitive digital landscape, customers don’t simply buy — they follow a multi-stage process that starts with discovering your brand and can end with lifelong loyalty or brand advocacy. This article breaks down the key stages of the customer journey in a visual and simple way, showing how you can create infographics to explain and optimise each phase.
- What Is the Customer Journey?
- Stage 1: Awareness — Grabbing Attention
- Stage 2: Consideration — Building Trust
- Stage 3: Purchase — Closing the Deal
- Stage 4: Retention — Keeping the Customer Happy
- Stage 5: Loyalty and Advocacy — Turning Customers into Champions
- How to Use Infographics Across the Customer Journey
- Benefits of Using Infographics in the Customer Journey
- Infographic Best Practices for High Impact
- References
What Is the Customer Journey?
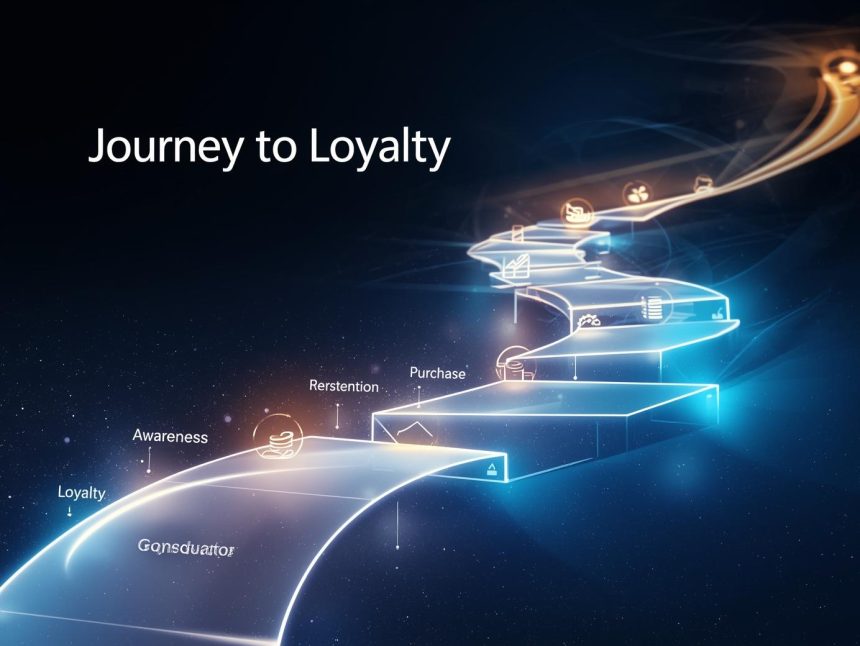
The customer journey is the process a customer goes through before, during, and after making a purchase. It includes five key stages:
- Awareness
- Consideration
- Purchase
- Retention
- Loyalty/Advocacy
Mapping this journey helps brands better understand their audience, personalise communication, and build stronger long-term relationships. According to Salesforce, 80% of customers say the experience a company provides is as important as its products or services (Salesforce, 2023).
Creating infographics for each stage helps simplify this process and allows your audience or team to grasp it at a glance.
Stage 1: Awareness — Grabbing Attention
Goal: Let people know your brand exists.
Customers at this stage are not ready to buy. They might not even realise they have a problem yet. Your goal is to educate and create brand visibility.
Best Content Types for Infographics:
- Problem vs. Solution visuals
- Statistics that reveal a pain point
- Brand story graphics
Example Tool to Create Infographics:
Canva offers free templates to visually highlight key stats or market pain points.
Key Tip: Use bold headlines and strong visuals to make your message stick.
According to Demand Gen Report, 47% of buyers view 3–5 pieces of content before engaging with a sales rep (Content Marketing Institute, 2023). That makes visual content like infographics essential at this stage.
Stage 2: Consideration — Building Trust
Goal: Help prospects compare and understand why your solution is better.
At this stage, people are actively researching options. Your job is to stand out by showing the value of your product or service.
Best Infographic Ideas:
- Comparison charts (your solution vs. competitors)
- Step-by-step process of your service
- How-it-works diagrams
Use a tool like Venngage to build a product comparison infographic or a visual walkthrough.
Key Data Insight: 70% of consumers say connected processes—such as seamless handoffs between departments—are very important to winning their business (Salesforce, 2023).
Stage 3: Purchase — Closing the Deal
Goal: Guide the customer to a confident purchase.
When a customer is ready to buy, your infographic should reduce friction and provide reassurance.
Infographic Types for This Stage:
- Pricing tables
- “What you get” checklists
- Customer testimonials with star ratings
Pro Tip: Add visual trust signals (like logos of clients or security badges) and include a clear call-to-action (CTA).
Studies show 88% of consumers trust online reviews as much as personal recommendations (BrightLocal, 2024). So using testimonial infographics can be very persuasive.
Tools like Piktochart help you combine charts and customer quotes into a single visual.
Stage 4: Retention — Keeping the Customer Happy
Goal: Deliver consistent value so the customer stays with your brand.
It’s more cost-effective to keep a customer than to acquire a new one. Bain & Company reports that increasing customer retention by just 5% can increase profits by 25% to 95% (Reichheld & Sasser, 1990).
Useful Infographics at This Stage:
- Onboarding journeys
- Product usage tips
- Support guides and self-help visuals
Use infographics to make education simple. For example, create a “Getting Started with Our Tool” visual checklist or step-by-step graphic.
Bonus Tip: Include QR codes in your infographics that link to tutorial videos or FAQ pages.
Stage 5: Loyalty and Advocacy — Turning Customers into Champions
Goal: Encourage happy customers to spread the word.
Satisfied customers become your best marketers. They bring referrals, reviews, and repeat purchases.
Effective Infographics:
- Referral program visuals (e.g., “Refer a Friend & Get $10”)
- Loyalty program tiers explained
- Customer success stories visualised
According to Nielsen, 92% of people trust recommendations from friends and family more than any other type of advertising (Nielsen, 2023). Infographics showing referral steps or member perks can encourage advocacy.
Tools like Visme allow you to design attractive loyalty reward visuals that customers will remember.
How to Use Infographics Across the Customer Journey
| Stage | Infographic Type | Distribution Channels |
| Awareness | Educational stats, pain points | Blogs, social media, ads |
| Consideration | Comparison charts, product features | Email campaigns, landing pages |
| Purchase | Pricing, testimonials, FAQs | Product pages, checkout popups |
| Retention | Onboarding visuals, feature guides | Email, help centre, customer portal |
| Advocacy | Loyalty rewards, referral program charts | Social media, email, user dashboards |
By mapping your infographic strategy to each journey stage, you increase engagement and conversion.
Benefits of Using Infographics in the Customer Journey
- Simplify Complex Concepts: Visuals are processed 60,000x faster than text by the brain (3M Corporation, 2022).
- Improve Retention Rates: People remember 80% of what they see, compared to 20% of what they read (Visual Teaching Alliance, 2023).
- Boost SEO Performance: Visual content increases time-on-page and reduces bounce rate.
- Support Cross-Team Alignment: Helps marketing, sales, and customer service teams stay on the same page.
Infographic Best Practices for High Impact
- Use bold headlines and clear icons.
- Keep colour schemes consistent with your brand.
- Add data-backed points for credibility.
- Include your logo and CTA on every infographic.
- Optimise for mobile viewing.
Note
The customer journey from awareness to loyalty is not a straight line — but infographics help your team and your customers clearly understand every stage. Whether you’re trying to explain your product’s benefits or show how your loyalty program works, a well-designed infographic can do it faster and better than text alone.
Infographics are not just decoration — they are a communication tool that supports experience, expertise, authority, and trust. Use them wisely across each stage of the journey, and you’ll not only win more customers, but you’ll also keep them for life.
More Read

References
BrightLocal. (2024). Local Consumer Review Survey 2024. Retrieved from https://www.brightlocal.com/research/local-consumer-review-survey/
Content Marketing Institute. (2023). B2B Content Marketing Insights. Retrieved from https://contentmarketinginstitute.com/
Nielsen. (2023). Global Trust in Advertising Report. Retrieved from https://www.nielsen.com/us/en/
Reichheld, F. F., & Sasser, W. E. (1990). Zero Defections: Quality Comes to Services. Harvard Business Review.
Salesforce. (2023). State of the Connected Customer Report (5th Edition). Retrieved from https://www.salesforce.com/resources/research-reports/state-of-the-connected-customer/
Visual Teaching Alliance. (2023). How the Brain Learns Through Visuals. Retrieved from https://www.visualteachingalliance.com/
3M Corporation. (2022). Visual Communication Research. Retrieved from https://www.3m.com/