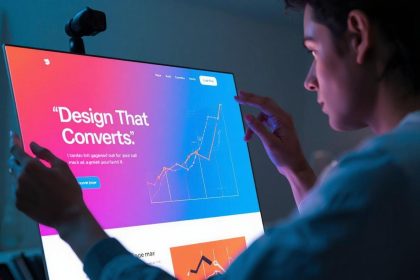
In 2025, digital marketing is moving faster than ever. Campaigns are launched in hours, not weeks, and marketers need to know what’s working right now—not at the end of the month. That’s where real-time marketing dashboards come in.
- What Is a Real-Time Marketing Dashboard?
- Why Real-Time Dashboards Are Essential in 2025
- Key Metrics to Include in a Real-Time Dashboard
- For CRM and Lead Tracking (via HubSpot, Salesforce):
- Top Real-Time Marketing Dashboard Tools in 2025
- How to Build a Real-Time Dashboard (Step-by-Step)
- Real-Life Example: Spotify’s Use of Real-Time Dashboards
- Common Mistakes to Avoid
- Best Practices for Real-Time Marketing Dashboards
- References
A real-time dashboard gives you live updates on your most important marketing metrics—from website traffic and email engagement to ad conversions—all in one place. Instead of waiting for static reports, marketers can adjust campaigns on the fly and make faster, smarter decisions.
This article explains what real-time marketing dashboards are, why they matter, which tools to use, and how to build one that works for your business.
What Is a Real-Time Marketing Dashboard?
A real-time marketing dashboard is a visual display that shows live data from your marketing channels. It collects data from tools like Google Analytics 4, Meta Ads, HubSpot, and more—allowing marketers to monitor campaign performance without delays (HubSpot, 2025).
Instead of manually checking different platforms, a dashboard pulls all your metrics into one view, so you can see everything in real time.
Why Real-Time Dashboards Are Essential in 2025
1. Fast Decisions = Better Results
Marketing moves quickly. With real-time data, you can pause a poor-performing ad, boost a winning email, or respond to a sudden traffic spike immediately (McKinsey & Company, 2023).
2. Smarter Campaign Optimization
Live dashboards show how users are responding now—not yesterday. This helps you test and tweak in the moment for better ROI.
3. Improved Team Collaboration
Dashboards help sales, marketing, and leadership work together using shared, live data (Salesforce, 2024).
4. Reduced Wasted Budget
By spotting underperforming campaigns early, you can shift ad dollars where they’ll have more impact (Gartner, 2024).
Key Metrics to Include in a Real-Time Dashboard
The best dashboards are focused, not overloaded. Choose metrics based on your campaign goals:
For Website Performance (via GA4):
- Sessions and users
- Traffic sources (organic, paid, social)
- Bounce rate
- Goal completions or conversions
- Page performance (top landing pages)
For Email Campaigns (via Mailchimp, Klaviyo):
- Open rate
- Click-through rate (CTR)
- Unsubscribe rate
- Revenue per email
- Email delivery rate
For Paid Ads (via Google Ads, Meta Ads):
- Impressions and reach
- Click-through rate (CTR)
- Cost per click (CPC)
- Conversions and ROAS
- Budget pacing
For Social Media (via Sprout Social, Hootsuite):
- Engagement rate
- Follower growth
- Video views
- Mentions or branded hashtags
For CRM and Lead Tracking (via HubSpot, Salesforce):
- New contacts
- Marketing qualified leads (MQLs)
- Lead-to-customer conversion rate
- Average deal size
Tip: Track only what you need to make daily or weekly decisions. Avoid cluttering your dashboard with vanity metrics (Chaffey, 2023).
Top Real-Time Marketing Dashboard Tools in 2025
1. Looker Studio (Google)
Best for: Free, flexible dashboards with Google integrations
- Connects to GA4, Google Ads, YouTube, and BigQuery
- Drag-and-drop charts and filters
- Supports automated report sharing
- Free to use
2. HubSpot Dashboards
Best for: All-in-one dashboards for CRM, email, and campaign performance
- Attribution tracking
- Ad campaign ROI analysis
- Lifecycle stage dashboards
- Built-in templates
3. Databox
Best for: Aggregating data from 70+ tools
- Prebuilt templates for SEO, PPC, and revenue KPIs
- Mobile app with notifications
- Slack alerts and goal tracking
4. Supermetrics
Best for: Automating data pulls into Google Sheets, Excel, or Looker Studio
- Supports over 100 marketing platforms
- Schedules automatic refreshes
- Easy-to-use no-code interface
5. Klipfolio
Best for: Advanced users and agencies
- Live connections to databases, CRMs, and ad platforms
- Custom metrics and KPIs
- Shareable links for clients and teams
6. Tableau
Best for: Enterprise-level, complex data visualization
- AI-powered forecasting
- Real-time alerting
- Multi-user collaboration
How to Build a Real-Time Dashboard (Step-by-Step)
Step 1: Set Your Objective
What decision will the dashboard help you make? Choose a focus: lead generation, ad performance, email ROI, etc.
Step 2: Pick Your Tools and Connectors
Select platforms you want to pull data from. Use native integrations (e.g., Google Ads to Looker Studio) or tools like Supermetrics for more flexibility.
Step 3: Select the Right Metrics
Keep it focused. For example, if you’re tracking an email campaign, show open rate, CTR, conversions—not social media metrics.
Step 4: Design for Clarity
Use bar graphs, pie charts, and scorecards. Group similar KPIs together (e.g., email stats in one section).
Step 5: Set Refresh Schedules
Choose how often your dashboard updates—some platforms offer updates every 15 minutes or faster.
Step 6: Share with Your Team
Provide stakeholders with access or scheduled reports. Tools like Databox and Looker Studio allow scheduled email delivery and Slack alerts.
Real-Life Example: Spotify’s Use of Real-Time Dashboards
Spotify uses live dashboards to monitor real-time user engagement, traffic spikes, and social mentions during major campaigns like “Spotify Wrapped.” The marketing team tracks app usage, click behavior, and share rates minute-by-minute—allowing instant optimization of paid spend, landing pages, and messaging. This has led to a 28% increase in campaign reach compared to static, end-of-week reporting (McKinsey & Company, 2023).
Common Mistakes to Avoid
- Tracking too much data: More is not better. Focus on KPIs that support your current goal.
- Ignoring refresh limits: Some tools only update data once daily. Check your refresh settings.
- No benchmarks: Always compare against previous periods or goals.
- Only sharing with marketers: Sales, execs, and customer success teams benefit too.
- Not mobile-ready: Choose platforms that support mobile apps or responsive design for access on the go.
Best Practices for Real-Time Marketing Dashboards
1. Keep it action-oriented
Don’t just show data—use metrics that drive decisions. Every chart should answer: “What should we do next?”
2. Align dashboards with your funnel
Group metrics by funnel stages (awareness, engagement, conversion) for better clarity.
3. Use alerts
Set up Slack or email notifications to alert you when key metrics spike or drop.
4. Review regularly
Even real-time dashboards should be reviewed weekly for patterns and optimization ideas.
5. Update stakeholders
Use dashboards during team meetings and campaign reviews to increase transparency and collaboration (Salesforce, 2024).
Note
Real-time marketing dashboards are no longer a luxury—they’re a necessity. They empower marketers to take control, adjust quickly, and improve ROI without waiting for end-of-month reports.
Whether you’re tracking a product launch, ad campaign, or newsletter performance, the ability to see and act on live data will set you apart in 2025’s fast-moving digital landscape.
Choose the right tools, focus on the right KPIs, and build dashboards that work as hard as your campaigns do.

References
Chaffey, D. (2023). Marketing dashboards and KPIs: How to report effectively. Smart Insights. https://www.smartinsights.com
Gartner. (2024). Agile marketing analytics: Real-time metrics and reporting. https://www.gartner.com
HubSpot. (2025). Marketing reporting dashboards overview. https://www.hubspot.com/products/marketing/analytics
McKinsey & Company. (2023). Accelerating decisions with real-time marketing data. https://www.mckinsey.com
Salesforce. (2024). State of marketing: Data-driven collaboration. https://www.salesforce.com
Statista. (2024). Use of marketing analytics dashboards by companies worldwide. https://www.statista.com